Quarterback Fatigue Analysis: Snap Count Tracking and Its Role in Shaping NFL Prop Bet Odds
Finley Schröder · Aug 24, 2026
Quarterback Fatigue Analysis: Snap Count Tracking and Its Role in Shaping NFL Prop Bet Odds
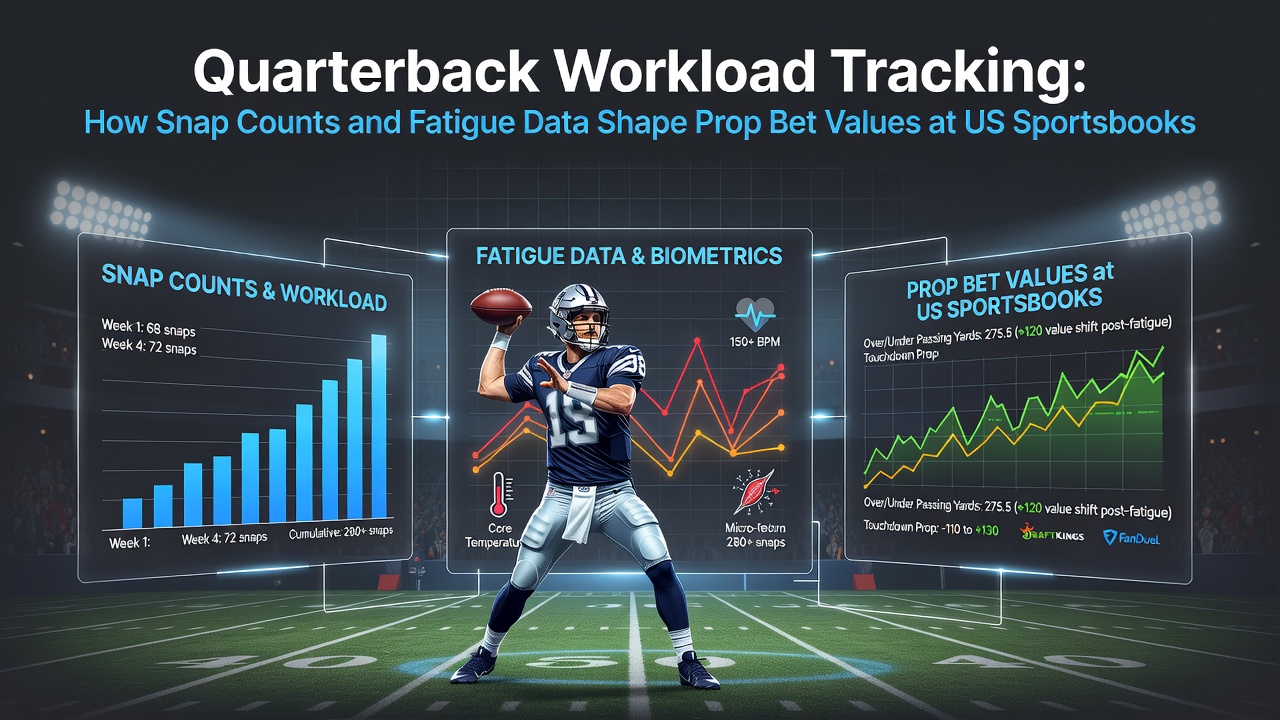
Quarterback workload tracking relies on detailed snap counts and fatigue indicators that sportsbooks incorporate into prop bet calculations across US markets, and these metrics help adjust lines for passing yards, touchdowns, and completion percentages before kickoff. Teams collect this information through wearable devices and game logs that measure repeated high-impact plays, while analysts convert the raw numbers into projections that betting operators use to set initial odds and in-game adjustments.
Snap Counts as Core Workload Indicators
Official game statistics track every offensive snap a quarterback takes, and these figures reveal patterns in playing time that correlate with performance drops after certain thresholds. Data from the 2025 season showed starters averaging 62 snaps per game in early weeks, yet those numbers climbed above 70 in playoff pushes where fatigue effects became measurable through reduced deep-ball accuracy. Sportsbooks monitor these counts because elevated snap totals often precede declines in yards per attempt, prompting line setters to shade props downward for upcoming matchups.
Training camp logs from August 2026 further illustrate how preseason snap distributions influence regular-season projections, with teams limiting starters to under 30 snaps per exhibition game to preserve freshness. This controlled exposure creates baseline data that oddsmakers cross-reference against historical injury rates tied to sudden workload spikes once the regular schedule begins.
Fatigue Data Integration at Sportsbooks
Advanced tracking systems combine snap counts with heart-rate variability and GPS-derived movement data to quantify cumulative fatigue, and operators at major US sportsbooks feed these composite scores into proprietary models that refine prop bet values. When a quarterback logs consecutive games above 65 snaps with limited rest, completion percentages on third downs have historically fallen by 4 to 6 points according to aggregated league reports. Bettors who follow these adjusted lines gain access to markets that reflect updated risk assessments rather than static season averages.
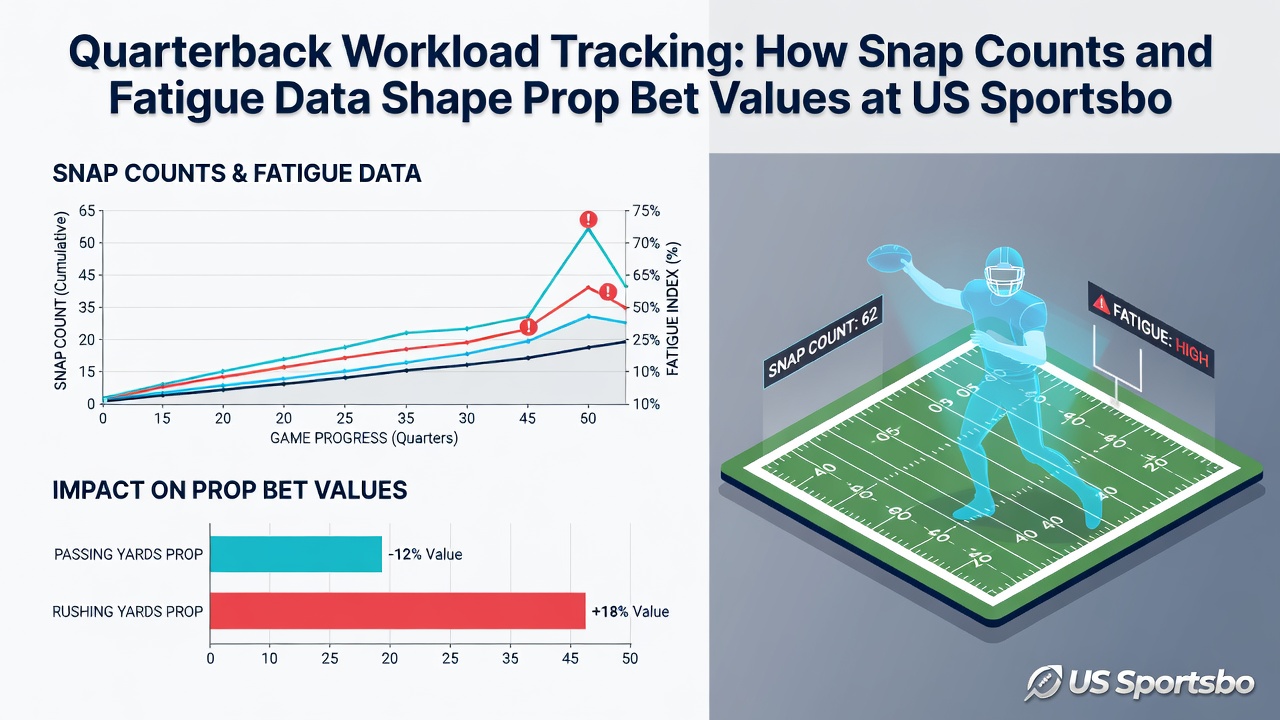
One study from the University of Michigan's kinesiology department examined quarterback recovery windows between starts and found that shorter intervals under six days increased interception rates by measurable margins. University of Michigan research supplies public summaries that sportsbooks reference when recalibrating over/under totals on passing attempts during short-week schedules.
Case Examples From Recent Seasons
During the 2025 campaign a veteran quarterback who averaged 68 snaps across four straight weeks saw his touchdown prop line drop from 1.8 to 1.4 at multiple Nevada-licensed operators after fatigue algorithms flagged elevated workload. Observers noted similar adjustments for mobile quarterbacks whose rushing attempts added extra stress markers beyond standard dropbacks. These shifts occurred because data platforms delivered real-time updates that allowed lines to move before public betting volume accumulated.
Another instance involved a rookie signal-caller whose snap count jumped from 45 to 72 in a single month, prompting sportsbooks to lower his season-long yardage props by 15 yards per game once internal models incorporated the change. External sources such as the NFL Players Association health reports provide supporting context on recovery protocols that teams publish, helping markets stay aligned with verified workload management strategies.
Market Implications for Prop Bettors
US sportsbooks publish quarterback props that incorporate snap-based fatigue filters, and sharp bettors track weekly usage reports to identify when lines lag behind the latest data releases. Because completion rates and red-zone efficiency metrics respond directly to accumulated snaps, operators update totals and player props midweek using inputs from both league statistics and team-provided recovery logs. This process keeps markets responsive while maintaining balance between handle and liability.
Conclusion
Snap count and fatigue tracking continue to refine how prop bet values form at US sportsbooks, with operators relying on layered data sets that capture both volume and recovery factors. As teams publish more granular workload information each August, the resulting adjustments give bettors clearer signals about where lines may shift before games begin.